The editors at Emergency Management Degrees decided to research the topic of:
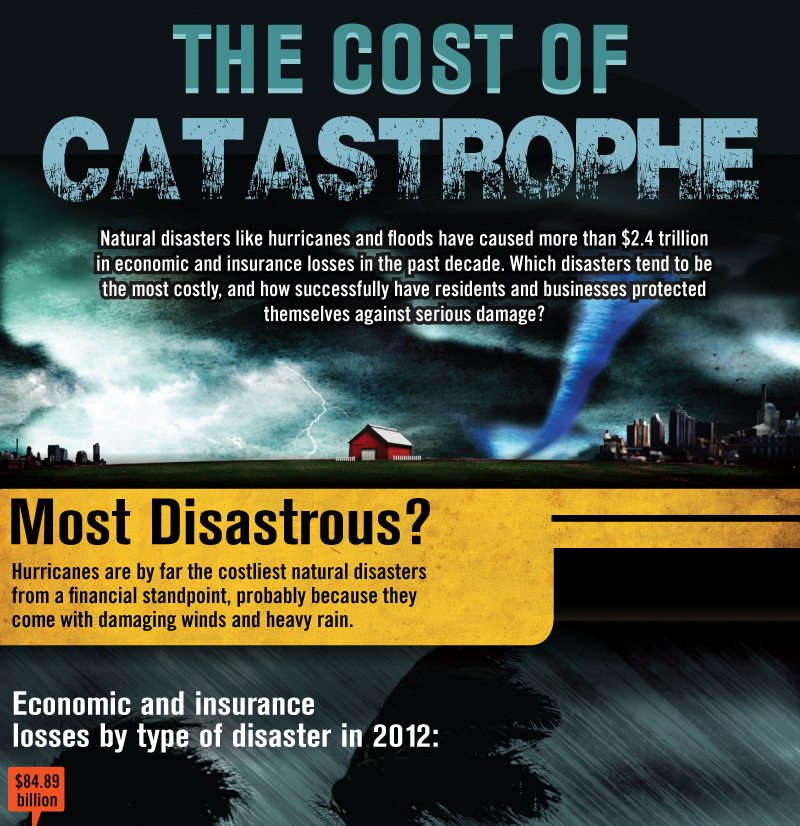
THE COST OF CATASTROPHE
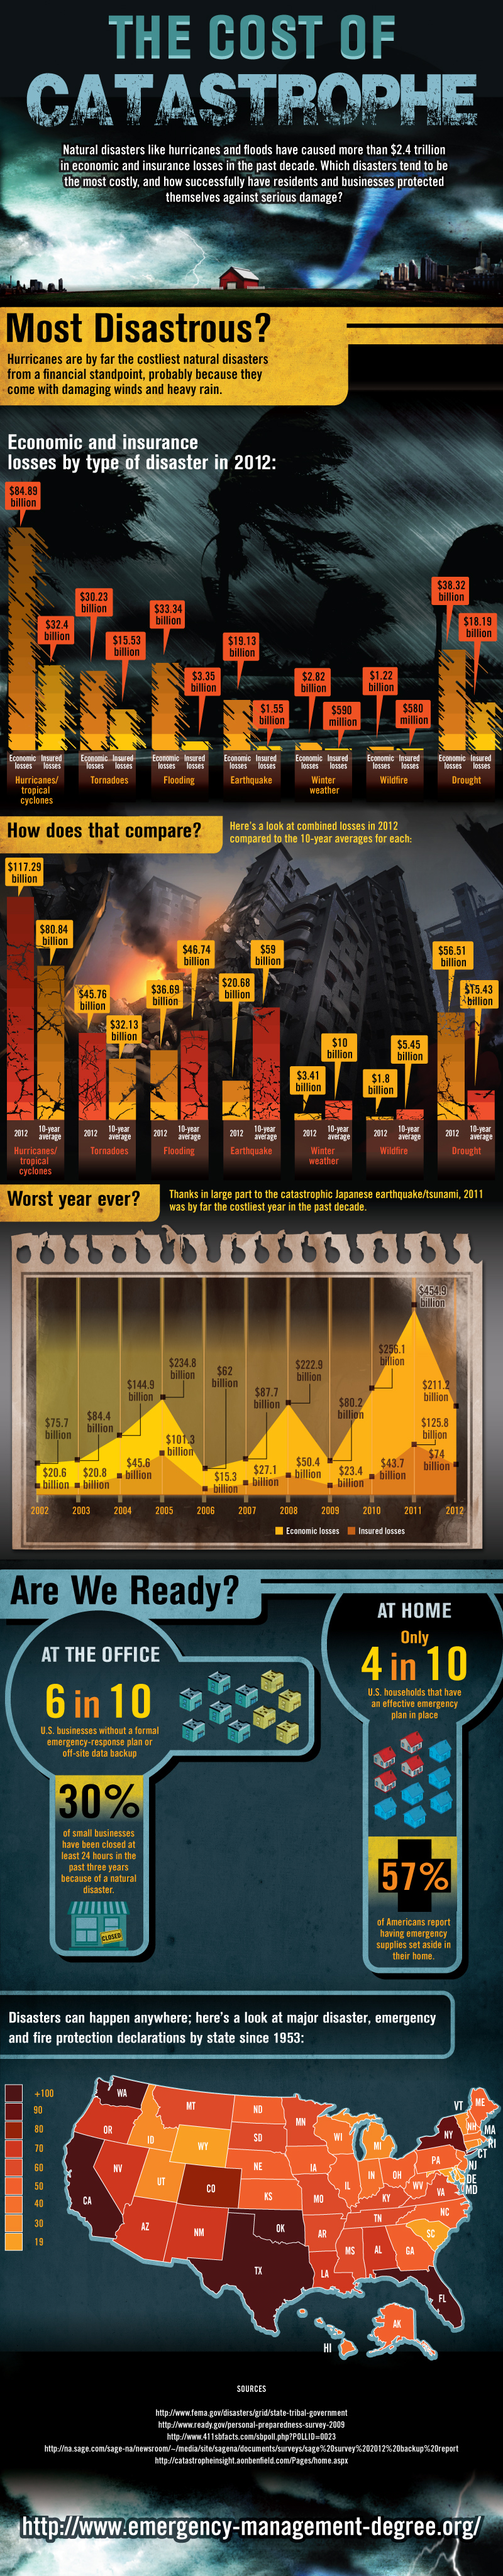
Natural disasters like hurricanes and floods have caused more than $2.4 trillion in economic and insurance losses in the past decade. Which disasters tend to be the most costly, and how successfully have residents and businesses protected themselves against serious damage?Most Disastrous?
Hurricanes are by far the costliest natural disasters from a financial standpoint, probably because they come with damaging winds and heavy rain.
Economic and insurance losses by type of disaster in 2012:
Disaster - Economic losses - Insured losses
- Hurricanes/tropical cyclones - $84,890,000,000 - $32,400,000,000
- Tornadoes - $30,230,000,000 - $15,530,000,000
- Flooding - $33,340,000,000 - $3,350,000,000
- Earthquake - $19,130,000,000 - $1,550,000,000
- Winter weather - $2,820,000,000 - $590,000,000
- Wildfire - $1,220,000,000 - $580,000,000
- Drought - $38,320,000,000 - $18,190,000,000
How does that compare?
Here's a look at combined losses in 2012 compared to the 10-year averages for each.
Disaster - 2012 - 10-year average
- Hurricanes/tropical cyclones - $117,290,000,000 - $80,840,000,000
- Tornadoes - $45,760,000,000 - $32,130,000,000
- Flooding - $36,690,000,000 - $46,740,000,000
- Earthquake - $20,680,000,000 - $59,030,000,000
- Winter weather - $3,410,000,000 - $10,020,000,000
- Wildfire - $1,800,000,000 - $5,450,000,000
- Drought - $56,510,000,000 - $15,430,000,000
Worst year ever?
Thanks in large part to the catastrophic Japanese earthquake/tsunami, 2011 was by far the costliest year in the past decade.
Year - Economic losses - Insured losses
- 2002 - $75,700,000,000 - $20,600,000,000
- 2003 - $84,400,000,000 - $20,800,000,000
- 2004 - $144,900,000,000 - $45,600,000,000
- 2005 - $234,800,000,000 - $101,300,000,000
- 2006 - $62,000,000,000 - $15,300,000,000
- 2007 - $87,700,000,000 - $27,100,000,000
- 2008 - $222,900,000,000 - $50,400,000,000
- 2009 - $80,200,000,000 - $23,400,000,000
- 2010 - $256,100,000,000 - $43,700,000,000
- 2011 - $454,900,000,000 - $125,800,000,000
- 2012 - $211,200,000,000 - $74,000,000,000
Are We Ready?
At the office 6 in 10U.S. businesses without a formal emergency-response plan or off-site data backup
30% of small businesses have been closed at least 24 hours in the past three years because of a natural disaster.
At home Only 4 in 10U.S. households that have an effective emergency plan in place
57% of Americans report having emergency supplies set aside in their home.Disasters can happen anywhere; here's a look at major disaster, emergency and fire protection declarations by state since 1953.
- Alabama - 77
- Alaska - 53
- Arizona - 72
- Arkansas - 63
- California - 214
- Colorado - 80
- Connecticut - 30
- Delaware - 20
- DC - 19
- Florida - 134
- Georgia - 53
- Hawaii - 45
- Idaho - 33
- Illinois - 59
- Indiana - 47
- Iowa - 54
- Kansas - 55
- Kentucky - 66
- Louisiana - 71
- Maine - 56
- Maryland - 29
- Massachusetts - 47
- Michigan - 34
- Minnesota - 64
- Mississippi - 64
- Missouri - 62
- Montana - 62
- Nebraska - 55
- Nevada - 74
- New Hampshire - 44
- New Jersey - 49
- New Mexico - 77
- New York - 91
- North Carolina - 52
- North Dakota - 52
- Ohio - 54
- Oklahoma - 169
- Oregon - 79
- Pennsylvania - 56
- Rhode Island - 21
- South Carolina - 21
- South Dakota - 63
- Tennessee - 60
- Texas - 333
- Utah - 31
- Vermont - 38
- Virginia - 61
- Washington - 112
- West Virginia - 59
- Wisconsin - 44
- Wyoming - 26
SOURCES
- https://www.fema.gov/disasters/grid/state-tribal-government
- https://www.ready.gov/personal-preparedness-survey-2009
- https://www.411sbfacts.com/sbpoll.php?POLLID=0023
- https://na.sage.com/sage-na/newsroom/~/media/site/sagena/documents/surveys/sage%20survey%202012%20backup%20report
- https://catastropheinsight.aonbenfield.com/Pages/home.aspx